
Water levels on the Great Lakes change seasonally each year and can vary dramatically over longer periods. Short-term changes are generally of greater magnitude than the monthly averages.
Short-term changes
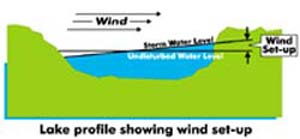
Some water level fluctuations are not a function of changes in the amount of water in the lakes, but are due to winds or changes in barometric pressure. These short-term fluctuations, often due to storms or ice jams, can last from a couple hours to several days and can be very dramatic.
One such phenomenon, known as wind set-up or storm surge, occurs when sustained high winds from one direction push the water level up at one end of a lake, which makes the level drop by a corresponding amount at the opposite end. Changes in barometric pressure can add to this effect. When the wind abruptly subsides or barometric pressure changes rapidly, the water often oscillates until it stabilizes again. This oscillation is called seiche (pronounced "sayshe"). These events are most common on Lake Erie due to its east-west orientation in an area of prevailing westerly winds and its generally shallow western end.
Seasonal changes
In the fall and early winter, when the air above the lakes is cold and dry and the lakes are relatively warm, evaporation from the lakes is greatest. Consequently, water levels decline to their seasonal lows.
As the snow melts in the spring, runoff to the lakes increases. Evaporation from the lakes is also least in the spring and summer when the air above the lakes is warm and moist and the lakes are cold. With more water entering the lakes than leaving, water levels rise to their peak in the summer. In the early fall, evaporation and outflows again begin to exceed the amount of water entering the lakes.
The range of seasonal water level fluctuations on the Great Lakes averages about 12 to 18 inches from winter lows to summer highs. Seasonal rises begin earlier on the more southern lakes that experience a slightly warmer climate. Lake Superior, the northernmost lake, is generally the last to peak, usually in August or September.
Long-term changes
Long-term fluctuations occur over periods of consecutive years. Continuous wet and cold years will cause water levels to rise. Likewise, consecutive warm and dry years will cause water levels to decline. Over the last century, the range from extreme high to extreme low water levels has been nearly 4 feet for Lake Superior and between 6 and 7 feet for the other Great Lakes.
History repeating itself
Long-term water level fluctuations are shown on a hydrograph, a plot of lake levels versus time. The hydrographs on this page show average monthly water levels for each of the Great Lakes and Lake St. Clair since the middle of the 19th century. Levels have been measured on most lakes since 1865, with the current network of water level gages operating since 1918.
As the hydrographs illustrate, Great Lakes water levels tend to follow a cyclical pattern. The Great Lakes system experienced extremely high water levels in the 1870s, early 1950s, early 1970s, mid-1980s and mid-1990s. Extremely low water levels were experienced in the late 1920s, mid-1930s, mid-1960s, and in the late 1990s leading up to today.
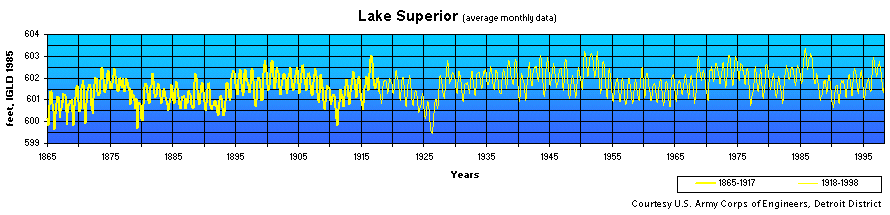
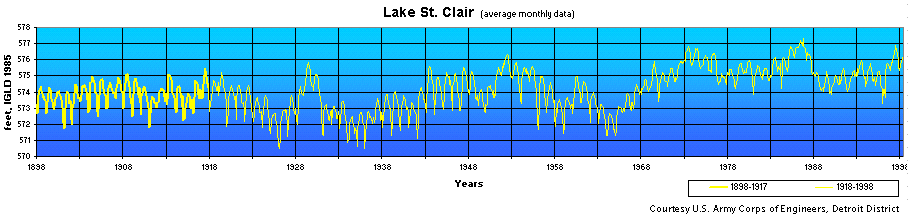
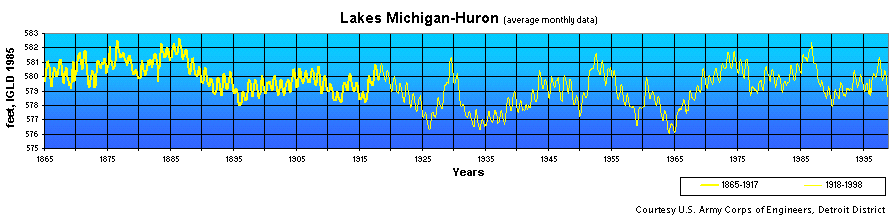
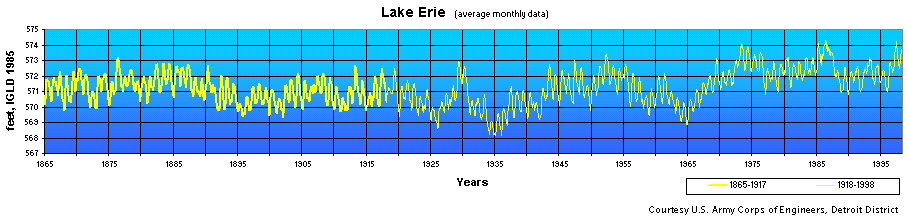
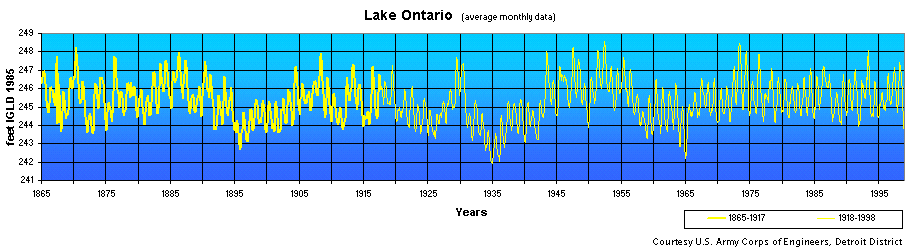
Graphics courtesy U.S. Army Corps of Engineers, Detroit District.